2nd Call for H.F.R.I.’s Research Projects to Support Faculty Members & Researchers
The Involvement of the Glutaredoxin and Thioredoxin systems of Escherichia coli in Cellular Function and Metabolism as Revealed by Classical Biochemistry and Modern Methods of High-Performance Biomolecular Analysis
Project No: 3352
Project Acronym: GluTrxomics
Scientifically Responsible – Alexios Vlamis
Metabolomics, summary
Part A: the metabolomics approach, general comparisons
This approach aimed at relating the composition of an obtained proteome with that of its corresponding metabolome. The intention was the unraveling of the contribution of Grx1, 2 and 3 in cellular metabolism by correlating an observed proteome and its corresponding metabolome. To this aim, null mutants for Grx1, 2, 3, thioredoxin reductase and glutathione synthase were grown in minimal or rich media with the intention of comparing their proteomes and metabolomes to that of the wild type and each other. While all proteomes gave characteristic differences, comparison of the metabolomes proved much harder than expected. In the case for a single comparison of the null mutant for grxA vs the wt for one medium and growth condition, the analysis revealed more than 40.390 features, from which 5.386 were annotated using primarily the ECMDB and as surrogate the following four libraries: Mona, GNPS, HMDB, MassBank. The annotation has also encompassed deNovo software approaches based on chemical ontology principles via SIRIUS 6.0 and MSFinder 3.72 as well as in silico fragmentation tools i.e. CFMId and MetFrag. Work continued with the in silico metabolized databases MyCompoundID and Mines. Below follows a summary of a part of the metabolomic work with emphasis on the null mutant concerning Grx1 (grxA- strain).
Metabolomics report
The samples were received at the laboratory of Analytical Chemistry to the university of Athens (Professor Evangelos Gikas) where they were analysed by the following described protocol. 72 samples were received (Exponential and Static Phase of LB and M9 material).
Experimental
The proposed volumes were divided by two so as not to dilute the sample more than necessary.
LC-MS grade methanol was used as the solvent.
The volumes of the PDF file were added.
The samples were vortexed vigorously.
The samples were placed on a horizontal shaker for one hour.
The samples were sonicated for 30 minutes.
One ml of each sample was transferred to 2 mL Eppendorf tubes and stored at -80 °C.
The same experiment for the M9.
Centrifuge of the samples 10000 rpm 4o C for 10 min.
400 μL of the supernatant were received and diluted with 400 μL H2O with IS yohimbine, reserpine, 4 aminosalicylic acid, DI0, DI1, DI2, DI3, DI4.
qc sample (7 μL of each sampe (7*72 +504 μL H2O with IS).
store to -80 oC fridge until run.
IS (in parenthesis the volume in μL received from corresponding stock solutions of 1000 ppm: yohimbine (97.4 μL), reserpine (97.2 μL), 4 aminosalicylic acid (97.0 μL), DI0 (90.0 μL), DI1 (92.6 μL), DI2 (70.0 μL), DI3 (66.6 μL), DI4 (60.0 μL).
Three procedure blanks (methanol) were also analyzed Instrumental conditions.
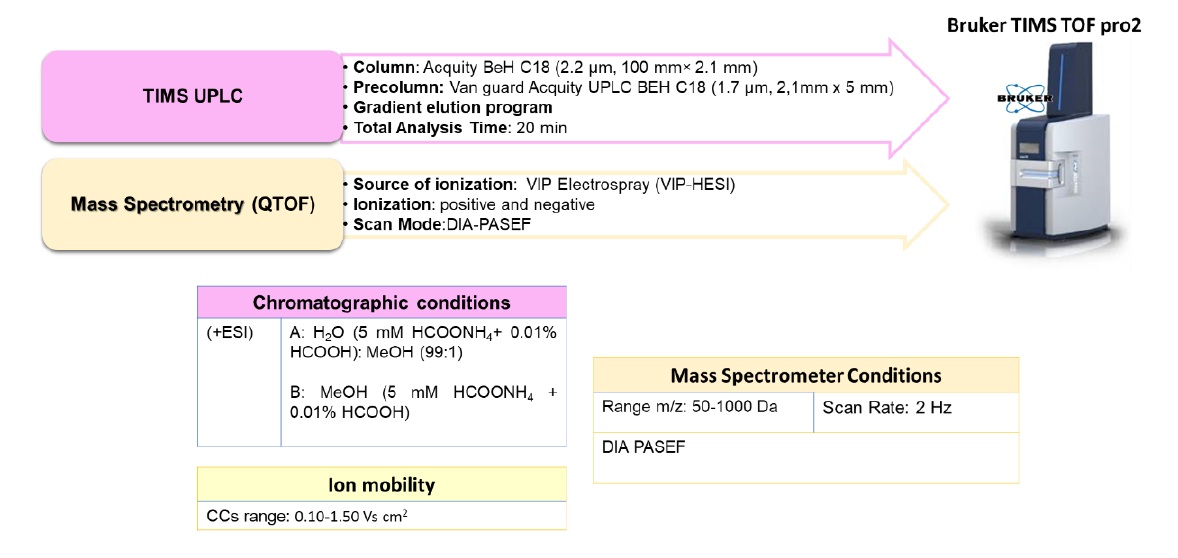
The samples were run using UPLC HRMS-MS analysis. The instrumental conditions are described in the following scheme.
Instrumental Conditions
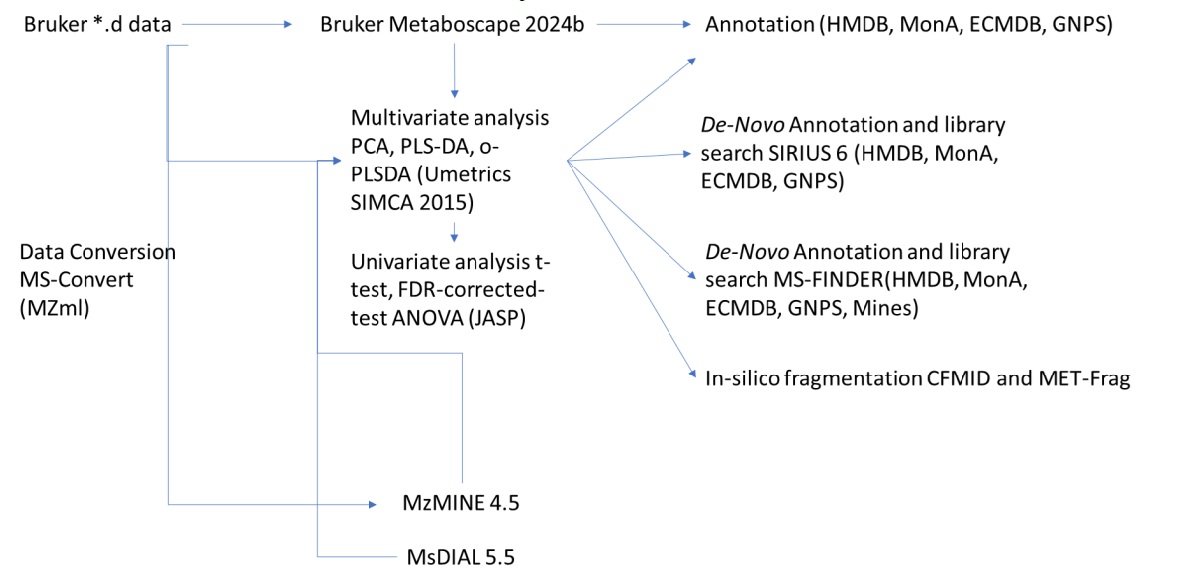
The data analysis of the experiment results combined multivariate and univariate statistics as schematically described below.
The peakpicking sodftware Metaboscape 2024b, mzMine and MSDial have been employedwhreas the annotation has been done employing Metaboscape 2024b, SIRIUS 6.0, MS-MINDER 3.73 and the in-silico fragmentation tools CFMID and Met_FRAG.
The HMDB, MONA and GNPS libraries were used whereas the MINEs and McID libraries of 1 and 2 reaction metabolisms have also been used. The Bio- Transformer 3.0 software has also been employed. The results are described below.
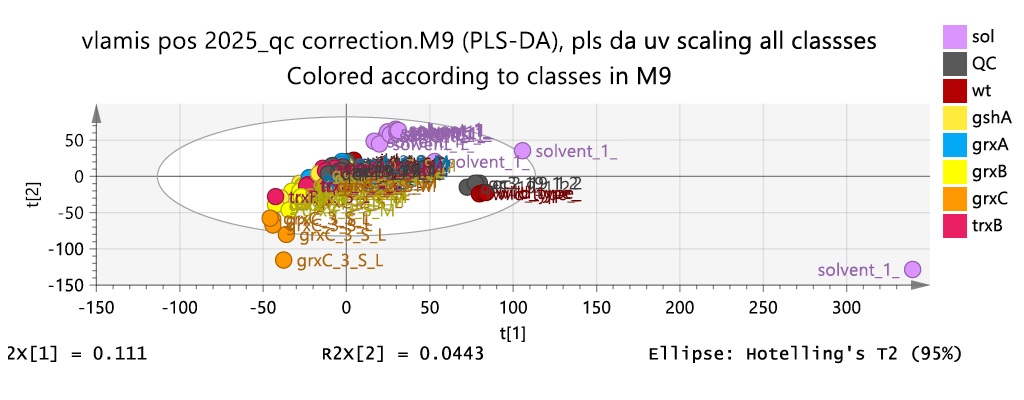
Comparison of all the groups by PLS-DA using UV and Pareto scaling
The QCs are clustered together, and the solvents outlying solvent was excluded from the analysis.
After removing the QC samples and solvent the results show a clear differentiation for each group.
Results showing each subtype
The different sample type has been differentiated both for the static and the exponential phase.
Exponential Phase
Static Phase
The results show that each subtype shows a distinct metabolomic signature.
Exponential vs static
The differentiation between the exponential and the static phase shows that they carry a markedly different metabolome.
LB vs M9
The growing medium affects the metabolome markedly.
Differentiation according to the genotype
The genotypes of the gshA strain are markedly different and are affected both due to the growing medium and the growing phase.
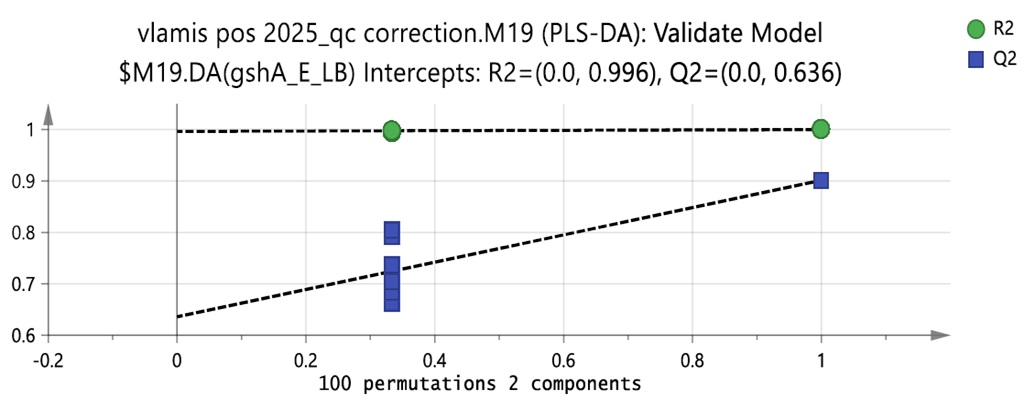
The statistical validity of the model has been examined by permutation testing employing 100 random permutations.
Part B: case study-analysis of the grxA- strain
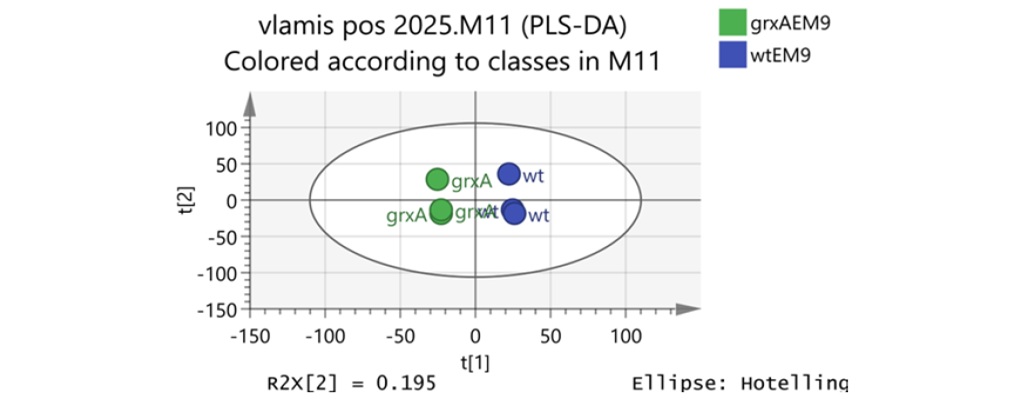
To explore in more detail the metabolomics signatures pairwise, comparisons have been made. For the grxA- genotype in the exponential phase using the M9 medium. The two groups carry a markedly differentiated phenotype. A PLS- DA model (mean centered pareto scaled – non-transformed) has been assembled and validated.
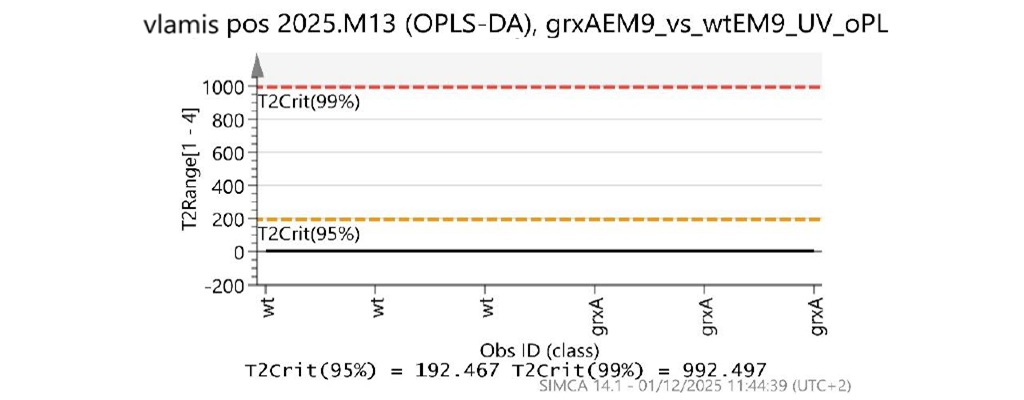
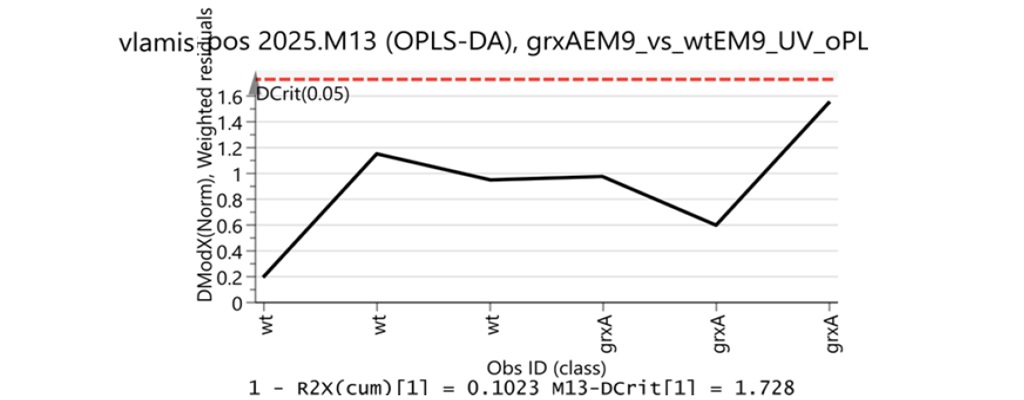
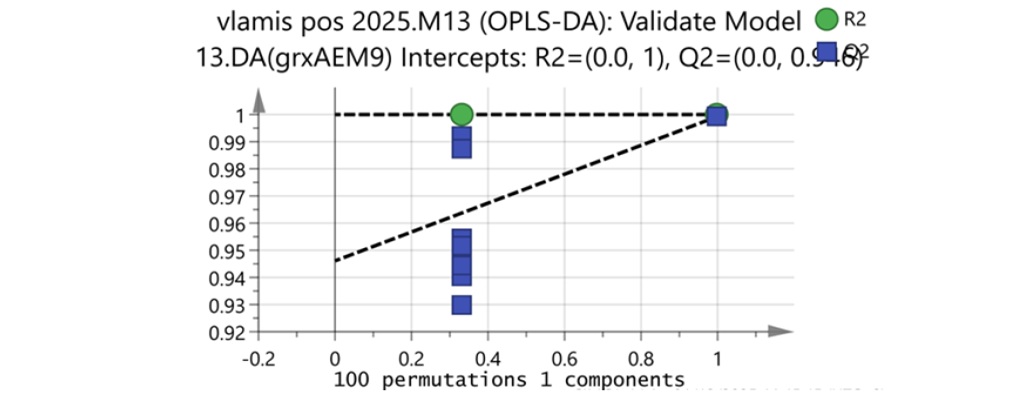
The model has been validated using an array of statistical tests:
Hotelling’s T2 test
DmodX test
100 random permutation testing
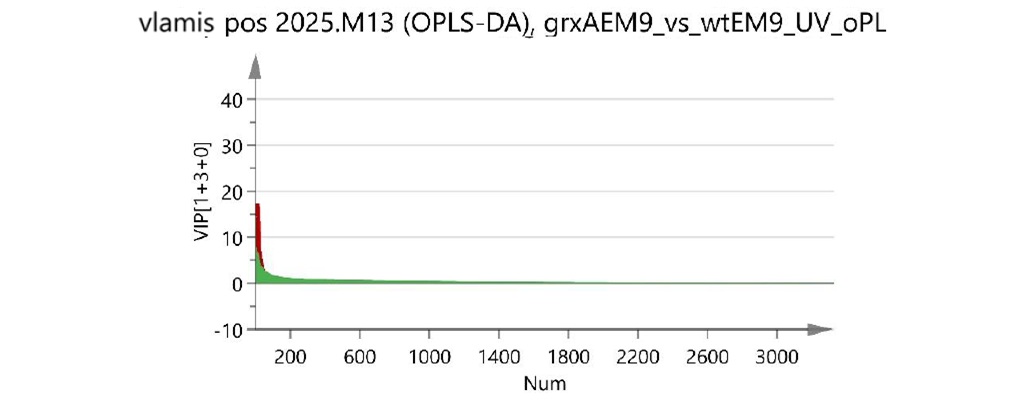
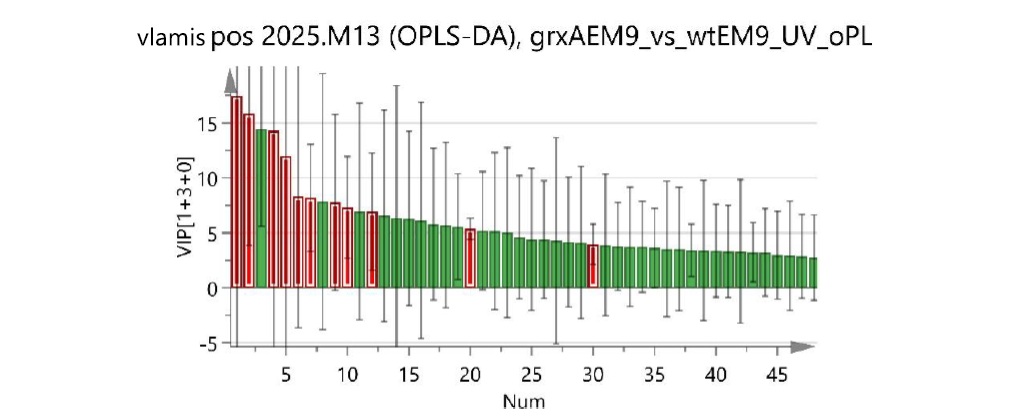
The most important features were selected employing the VIP’s (a zoomed detail is found in the second figure.
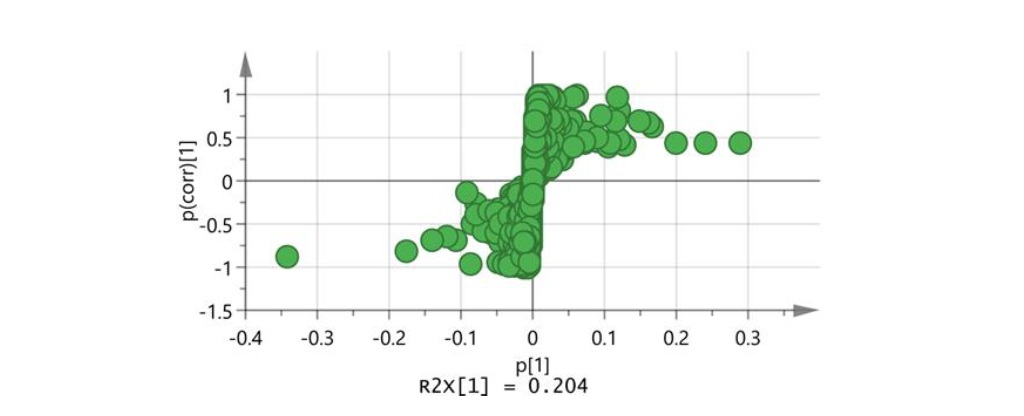
Whereas the statistical ruggedness of the selection has been done using an S-plt based on the Pareto scaling.
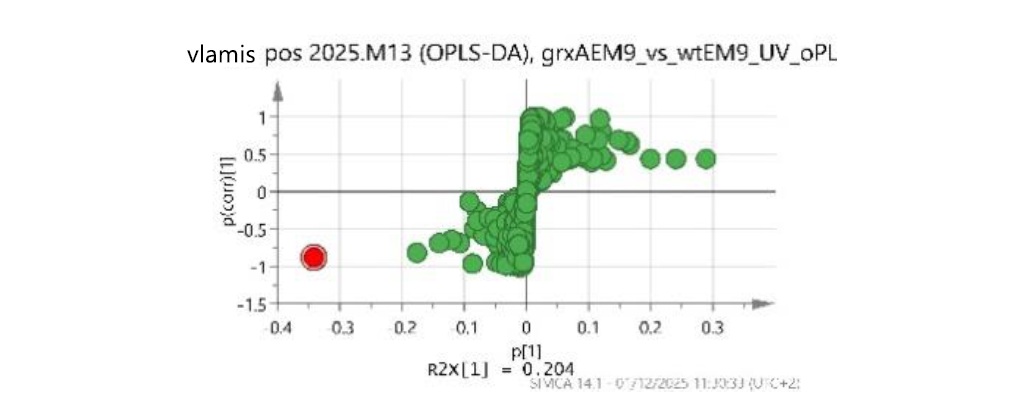
Identification of a metabolite with statistical significance.
Selected compounds with statistical significance (e.g. red dot below) were identified and presented as points of significant differentiation in the metabolism between the wilt-type and the null mutant for grxA. The full analysis and identity of all statistically significant metabolites is not presented because this material has not been published yet.